
Phosphorus reduction in Pennsylvania lakes and ponds starts with identifying watershed sources using land use mapping, soil tests, and high‑frequency water quality monitoring. Data from GIS models, autosamplers, and fingerprinting techniques guides targeted farm and land practices, including precision nutrient management, cover crops, buffers, and erosion control. In-lake tools such as aluminum or iron treatments, aeration, and selective dredging can curb internal loading and algal blooms. Practical, long-term planning approaches are outlined next.
Why does a single nutrient so strongly dictate the health of Pennsylvania’s lakes and ponds? In most freshwater systems, phosphorus is the limiting nutrient; modest increases trigger disproportionate biological responses.
Concentrations above ~30 µg/L often accelerate algal and cyanobacterial blooms, reducing Secchi depth, depleting dissolved oxygen, and stressing cold-water fisheries.
Above 30 µg/L, phosphorus fuels harmful blooms, clouding waters, depleting oxygen, and imperiling cold‑water fisheries
Internal loading from legacy phosphorus in sediments can prolong impairment even after external inputs decline. Elevated phosphorus also increases treatment costs for drinking-water utilities and undermines recreational value. By driving excess algal growth, elevated phosphorus accelerates eutrophication and associated symptoms such as hypoxia, nuisance weeds, and sediment-related water quality decline.
Understanding these cause‑effect relationships enables precision management: setting site‑specific phosphorus targets, prioritizing high-impact controls, and tracking ecological response with quantitative metrics.
Before phosphorus loads can be reduced effectively, their dominant sources within the watershed must be quantified and spatially defined. A rigorous source assessment integrates land use mapping, soil phosphorus testing, and high‑frequency water quality monitoring at strategic stream nodes and inlets.
Practitioners increasingly employ GIS-based nutrient loading models, drone or satellite imagery, and autosamplers triggered by storm events to distinguish baseflow from event-driven contributions. Isotopic and fingerprinting techniques can further apportion phosphorus among wastewater, legacy sediments, and upland sources.
This diagnostic phase prioritizes “hot spots” and “hot moments,” enabling targeted, cost-effective interventions rather than diffuse, low-yield investments.
When phosphorus “hot spots” and critical source areas have been delineated, the most powerful levers for reducing loads to Pennsylvania lakes and ponds are often land and farm practice changes that interrupt the soil–water–phosphorus pathway.
Data show that edge-of-field losses respond strongly to precision nutrient management, hydrologic disconnection, and erosion control. Innovators increasingly integrate field sensors, variable-rate application, and performance benchmarking to document load reductions.
Although controlling watershed inputs remains foundational, many Pennsylvania lakes and ponds also require in‑lake phosphorus reduction tools to stabilize water quality and restore designated uses. Core technologies include aluminum- or iron-based phosphorus inactivation, hypolimnetic aeration or oxygenation, strategic dredging of legacy-rich sediments, and targeted biomanipulation to suppress internal recycling.
Emerging options—such as lanthanum-modified clays, nanostructured sorbents, and regenerative media within circulation systems—offer higher binding efficiencies and longer service lives. Tool selection relies on site-specific diagnostics: sediment phosphorus fractions, internal load estimates, mixing patterns, and residence time.
Performance monitoring verifies load reductions and guides adaptive treatment optimization.
A durable phosphorus reduction plan for a Pennsylvania lake or pond is built on quantifiable objectives, clearly defined responsibilities, and mechanisms for continuous performance review. Sustainable programs anchor targets to watershed-specific loading models, then institutionalize adaptive management cycles.
Stakeholders formalize commitments through inter-municipal agreements, budget line items, and data-sharing protocols with conservation districts and utilities.
Phosphorus reduction efforts generally increase nearby property values by improving water clarity, reducing algal blooms, and enhancing recreational appeal. Empirical studies show premium gains where measurable nutrient load reductions, transparent monitoring, and innovative best-management practices are implemented and communicated to prospective buyers.
Multiple Pennsylvania programs provide assistance: DEP Growing Greener grants, Chesapeake Bay cost-share, NRCS EQIP, Conservation Excellence Grants, and county conservation district mini-grants. “A stitch in time saves nine” captures their focus on preventative, performance-based nutrient-reduction investments.
Individual shoreline homeowners implement vegetated buffer strips, rain gardens, permeable pavements, and phosphorus‑free fertilizers, retrofit downspouts to infiltration systems, stabilize eroding banks with bioengineering, maintain septic performance, and coordinate sensor-based monitoring to supply high-resolution nutrient and sediment data complementing watershed-scale interventions.
Residents can use tools like SecchiDisk.org, WaterReporter, CyanoTracker, and EPA’s How’s My Waterway—plus citizen kits with digital turbidity meters and colorimetric phosphate strips—to log readings, visualize trends, share data, and trigger early, community-scale interventions.
Communities should publish concise dashboards showing phosphorus metrics, trendlines, and project milestones, complemented by quarterly briefings, interactive maps, and citizen-science leaderboards, translating technical data into visual insights that validate impact, prompt iteration, and sustain long-term volunteer and stakeholder engagement.
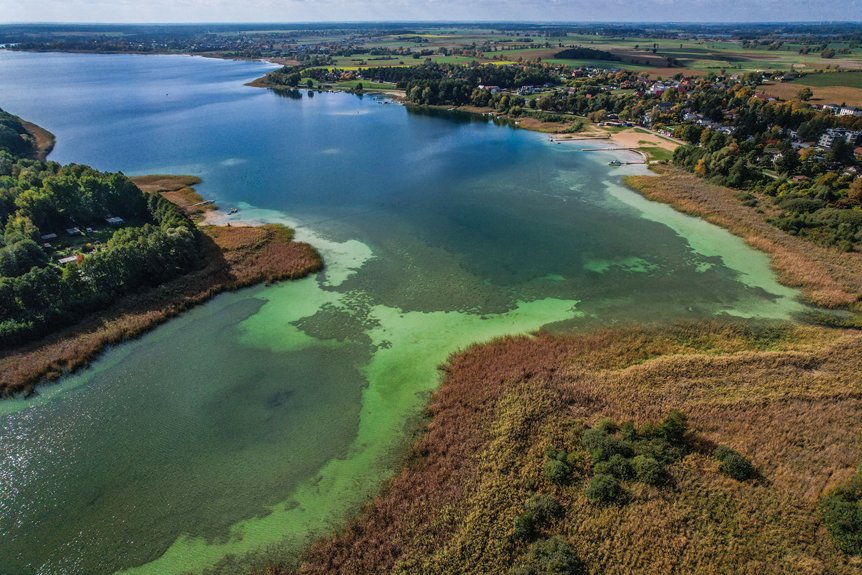
While phosphorus loading can seem abstract—measured in pounds per acre and milligrams per liter—it reveals itself in stark contrast: clear water turned turbid, native plants displaced by algal mats, recreation curtailed by health advisories. Yet the same data that diagnose decline also chart recovery: targeted BMPs, calibrated in-lake treatments, and adaptive monitoring. Side by side, degraded baselines and improving trendlines underscore a single message: disciplined phosphorus management rewrites a lake’s future. For more information on how Clean Flo can improve the health of your lake or pond, visit us online at Clean Flo. You can also check out our video series on our YouTube channel.