
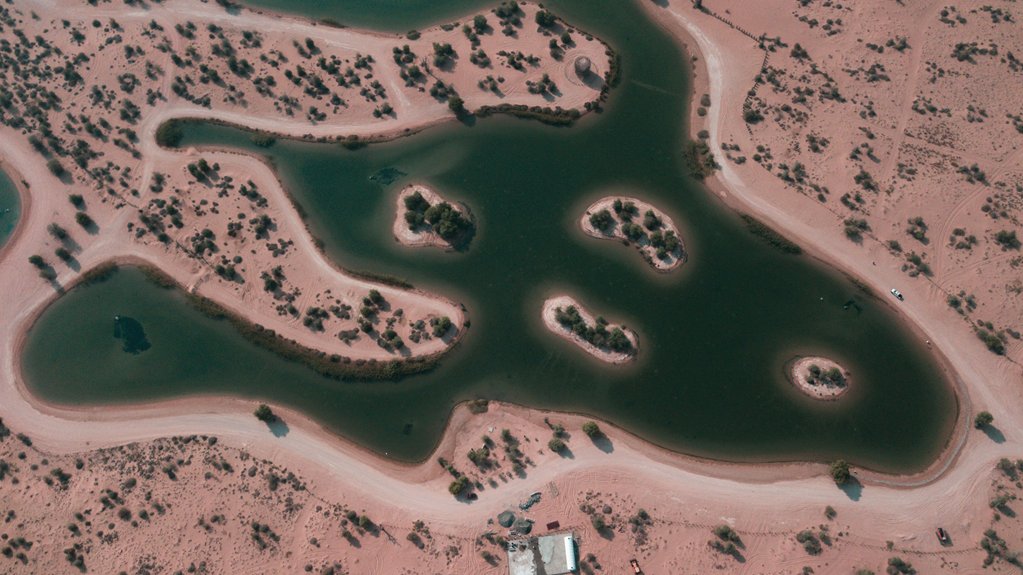
Bathymetry helps diagnose Pennsylvania lake problems by precisely mapping depth, volume, and basin shape. These data control stratification, hypolimnetic oxygen demand, and internal nutrient loading that drive algal blooms and clarity loss. Detailed contour maps expose over-deepened pockets, sediment deltas, and depositional troughs where contaminants and organic matter accumulate. This morphometric framework supports targeted dredging, aeration, habitat design, and nutrient reduction. With a clear bathymetric picture, managers can interpret emerging lake issues much more accurately and strategically.
How does the shape of a lake’s basin control its ecology, water quality, and management outcomes in Pennsylvania? Bathymetry defines volume, shoreline complexity, and depth–area–volume relationships, which govern thermal structure, mixing regimes, and hypolimnetic oxygen demand. In glacial and impoundment lakes statewide, basin morphology determines habitat mosaics, macrophyte colonization limits, and internal nutrient recycling potential. Managers increasingly leverage high‑resolution bathymetric datasets to optimize aeration design, sediment management, and nutrient load reduction. Pennsylvania’s diverse basin types—shallow eutrophic impoundments, kettle lakes, and flood‑control reservoirs—require morphology‑specific interventions, making bathymetry foundational to predictive modeling, regulatory compliance, and adaptive lake restoration planning. By integrating bathymetric data with targeted monitoring of hypolimnetic oxygen demand, managers can better address eutrophication, hypoxia, and nutrient recycling to restore natural lake health.
Beneath the lake surface, bathymetric data expose problem zones that remain invisible to routine shoreline or surface observations. High‑resolution depth grids quantify basin morphometry, revealing over-deepened pockets where water residence times, stratification stability, and oxygen demand intensify.
Spatial analysis of slopes and curvature pinpoints erosive escarpments, sediment deltas, and depositional troughs that concentrate legacy contaminants or nutrients. Comparing historical and current bathymetric surveys establishes volumetric loss from infilling and identifies corridors of accelerated sediment delivery.
Integrating these depth-derived metrics with hydrologic and watershed models allows managers to isolate physical stressors driving ecological impairment before symptoms become operationally evident.
Extending beyond structural diagnostics, bathymetric data directly inform predictions of algal bloom risk and water clarity in Pennsylvania lakes. Depth gradients control thermal stratification, hypolimnetic volume, and residence time—all primary regulators of nutrient availability and light climate.
High-resolution depth models delineate shallow benches where light reaches the bottom, promoting periphyton and macrophyte growth that can sequester or recycle phosphorus. Steep basins with constrained hypolimnia foster low-oxygen zones, internally loading legacy nutrients.
Although often viewed primarily as navigation aids, bathymetric maps function as quantitative templates for locating and prioritizing sediment removal in Pennsylvania lakes. Depth differentials, when compared against historical surveys or design elevations, reveal depositional deltas, infilled coves, and constricted basins where storage capacity and residence time have been altered.
Managers can overlay isobath changes with watershed land‑use, inlet flow paths, and particle size data to calculate sediment volumes and optimize dredging footprints. This reduces unnecessary excavation, minimizes turbidity plumes, and preserves undisturbed cold‑water refugia while restoring design depth, recreational draft, and flood‑attenuation performance.
When bathymetric data are integrated with temperature profiles, dissolved oxygen curves, and substrate surveys, they become a primary tool for designing fish habitat and aquatic plant management in Pennsylvania lakes.
Depth grids delineate thermally stable refuge zones, hypoxic risk layers, and contour breaks preferred by key sportfish. Managers can then position brush piles, rock reefs, and spawning shelves with meter‑scale precision.
The same bathymetric surfaces quantify littoral slope, vegetative colonization depth, and fetch exposure, informing where to encourage native macrophytes and where to suppress nuisance growth using targeted herbicide bands, benthic barriers, or strategically placed shade structures.
Bathymetric mapping not only guides habitat placement within a lake, it also defines how watershed runoff interacts with basin geometry to shape water quality outcomes in Pennsylvania waters.
Depth gradients, fetch, and hypsographic curves determine where storm-driven inflows deposit fine sediments, phosphorus, and organic carbon.
Steep-sided basins route runoff to profundal zones, intensifying hypolimnetic oxygen demand and internal nutrient loading.
Shallow, broad shelves promote rapid heating, cyanobacterial blooms, and macrophyte expansion under elevated nutrient inputs.
Modern bathymetric surveying of Pennsylvania lakes relies on an expanding toolkit that ranges from low-cost, handheld GPS–echo sounder combinations to fully integrated hydroacoustic and remote sensing platforms.
Modern lake mapping now spans affordable GPS–sonar rigs to advanced, fully integrated hydroacoustic and remote sensing systems
Entry-level single‑beam systems, deployable from jon boats or kayaks, can produce depth grids at <$5,000 including software, suitable for small impoundments.
Mid‑range RTK‑GNSS paired with dual‑frequency echosounders improves vertical precision for sediment budgeting, typically $15,000–$40,000.
High‑end multibeam sonars and LiDAR bathymetry, often accessed via service contracts, exceed $75,000 in capital value but deliver centimeter‑scale models, critical for quantifying morphometric change, habitat complexity, and infrastructure risk.
Although echo sounders and GNSS units can now map lake bottoms at centimeter scales, those raw depth points only gain value once they are converted into decision‑ready management products linked to specific stressors in Pennsylvania lakes. Practitioners integrate depth grids with watershed load estimates, thermal profiles, and aquatic vegetation surveys to pinpoint hypoxic zones, sediment deltas, and invasive plant refugia.
From these overlays, managers quantify sediment removal targets, prioritize dredging cells, and delineate no‑till or buffer zones upstream. Scenario modeling then evaluates alternative interventions—drawdowns, aeration, selective harvesting—against metrics such as habitat volume, phosphorus retention, and recreational capacity.
Pennsylvania lakes should be resurveyed every 5–10 years; high-sedimentation, eutrophic, or heavily managed systems warrant 3–5 year intervals. Adaptive scheduling using remote sensing, LiDAR, and autonomous platforms optimizes update frequency, capturing morphometric shifts impacting habitat, hydrodynamics, and nutrient cycling.
Ownership typically rests with the commissioning party: private lake owners under contract, or agencies funding public-interest surveys. Pennsylvania law adds overlays—intellectual property rights, data-sharing clauses, and navigable‑waters doctrines can reallocate control, licensing terms, and ecological decision-making authority.
Yes. Pennsylvania lake managers can leverage DEP Growing Greener grants, DCNR C2P2, and federal EPA Section 319 funds, often embedding bathymetric surveys within watershed assessments, TMDL implementation, sediment-load modeling, and climate-resilient lake restoration pilot projects.
Citizen scientists or lake associations can collect GPS-linked depth soundings via low‑cost sonar on small boats; for example, a volunteer-led Keuka Lake project generated high‑resolution bathymetric grids, informing macrophyte management, sediment hotspots, and climate‑driven stratification modeling.
Lake managers need training in GIS, acoustic/sonar principles, geostatistics, sediment dynamics, aquatic habitat modeling, and hydrodynamics, plus skills in data quality control, uncertainty analysis, and integrating bathymetry with water-quality, watershed, and climate datasets for adaptive, innovation-driven management.
Like a CT scan beneath a calm surface, Pennsylvania’s bathymetric data transforms blue ink into evidence: depth contours revealing oxygen refuges, silt deltas, and algal “fault lines.” Each line on the map becomes a watershed fingerprint, linking runoff coefficients, Secchi depths, and chlorophyll‑a to the lake’s carved basin. Read correctly, these submerged isobaths serve as both diagnosis and prescription—guiding restoration targets, prioritizing interventions, and quietly forecasting each lake’s ecological future.
For more information on how Clean Flo can improve the health of your lake or pond, visit us online at Clean Flo. You can also check out our video series on our YouTube channel.