DISRUPTION OF ECO SYSTEM BALANCE
WHAT IS THE TIPPING POINT THAT CAUSES THE FOOD WEB TO COLLAPSE?
The tipping point in eutrophication occurs when sediment nutrient recycling becomes self-sustaining, and the food web can no longer maintain nutrient clearance, leading to a fundamental transformation in the ecosystem.
At this stage, the water body not only loses its ability to maintain nutrient clearance and the balance necessary for water quality, but the transformation to nutrient recycling also creates locked-in feedback mechanisms that cause the lake to worsen its own condition.
WHY IS THE EUTROPHICATION TIPPING POINT IMPORTANT?

The impairment of the food web’s capacity to clear nutrients may not always be apparent through dramatic events like fish kills.
Instead, overt symptoms such as invasive weeds, excessive algae, and eventually toxic cyanobacteria Harmful Algal Blooms (HABs) become more noticeable.
Many people fall into the trap of reactively fighting these symptoms using potent chemical herbicides, algaecides, and chemical precipitants to remove phosphorus from the water column. However, these treatments can exacerbate the problem by creating more organic sediment from decomposing weeds and algae, increasing the sediment nutrient stockpile available for recycling, and accelerating the decline of the ecosystem.
The Government Accountability Report on the failure to manage hypoxia and HABs specifically called out these practices as counterproductive.
Investing in these chemical treatments is essentially paying good money to make lakes worse.

HOW DO YOU ASSESS THE TIPPING POINT?
While the food web can be assessed at many levels, such as fish census, zooplankton, and phytoplankton, these assessments can be expensive and fail to address the root cause.
Rather than getting distracted by symptomatic chemical treatments or costly fish censuses, it is often more cost-effective and informative to investigate the status of root cause factors.
Phytoplankton and zooplankton, which are foundation levels of the food web, are cheaper and easier to measure and draw conclusions from.
Collecting phytoplankton samples is relatively simple, and they can be sent to a specialized laboratory for professional analysis that details:
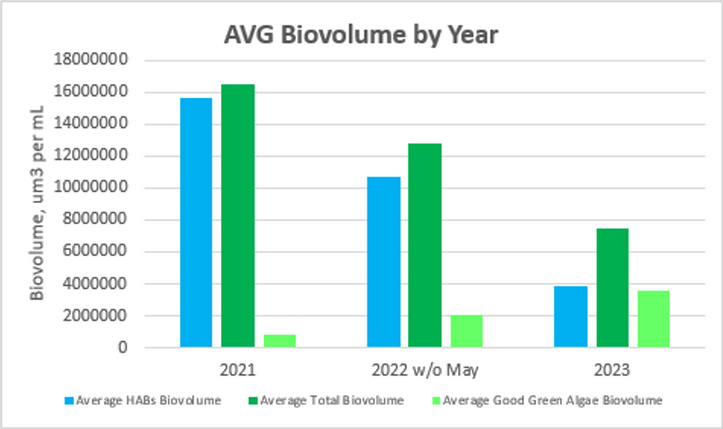
1. Phytoplankton Biovolume: This measure shows how excessive phytoplankton levels have become. When combined with measurements of hypoxia, the eutrophic status of the water body can be easily inferred.

2. Phytoplankton Taxonomy and Biodiversity: This analysis shows the extent to which beneficial algae species that provide good nutrition for the food web have been displaced by toxic cyanobacteria species.
High phytoplankton levels and cyanobacteria predominance provide insight into the eutrophic status of the water body and help forecast its future trajectory.
Download the Lake Management ACTION Plan E-Book
Ready to explore how oxygenation can transform your lake? Download Clean-Flo’s Lake Management ACTION Plan E-Book to learn more about our innovative solutions, real-world results, and how we can help restore and protect your lake.