PERFORMANCE MEASUREMENT & REPORTING YOU CAN UNDERSTAND
PERFORMANCE MEASUREMENT & REPORTING
YOU CAN UNDERSTAND
At Clean-Flo International, we have a unique approach to restoring eutrophic lakes. We focus on eliminating hypoxia, Bio-Dredging away sediment nutrient stockpiles, getting rid of invasive weeds, preventing toxic cyanobacteria harmful algal blooms (HABs), and restoring the biodiversity and nutrient-clearing capacity of the food web.
Our approach is different because it works, and it’s based on sound scientific principles and simple logic.
We believe in transparency and want our clients to understand what we do, why we do it, and how our methods differ from others. That’s why we have two core principles when it comes to measuring and reporting performance.

LAKE MANAGEMENT PRINCIPLES
1. Simplify the Science:
 We want to help people better understand their lakes and make informed decisions to Save the Lake Lifestyle. Check out the Simplifying the Science section of our website to learn more about eutrophication and our approach to lake remediation. Simplifying the Science means getting clarity on the parameters that need to be measured and monitored to assess the performance of a lake restoration program.
2. Measure What Counts and What We Can Influence and Manage:
We focus on the critical factors that directly impact lake health and can be effectively managed through our remediation programs.
Oxygenation: We measure the oxygenation of the entire water body because it’s absolutely essential for any successful remediation and reversal of eutrophication.
Bathymetry: We measure how much Bio-Dredging has eliminated organic sediment and changed the depth profile of the lake.
Phycology: We closely monitor how the types of phytoplankton have shifted away from cyanobacteria dominance towards biodiversity and beneficial algae that provide better food for the food web. We also assess the reduction in total phytoplankton populations.
We often hear clients say, “Our current lake report doesn’t measure those things.” This is usually because their current lake management program isn’t having any positive impact on these critical factors, so there is nothing to report, even though they’re essential to measure and manage.
3. Easy to Understand Reports:
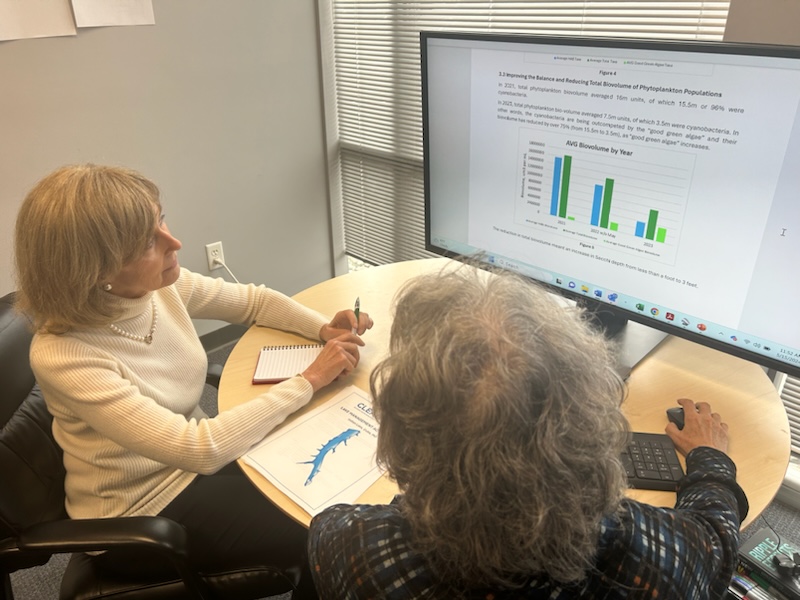
We write our reports in plain, easy-to-understand language. We provide data, charts, graphs, and tables that make the information accessible and understandable for everyone. This makes it easier for HOAs, Lake Boards, and Committees to share and explain these reports with their communities.
We’re committed to providing our clients with clear, concise, and informative reports that show the effectiveness of our lake remediation programs.
By focusing on the key parameters that matter and presenting the information in an easily digestible format, we empower our clients to make informed decisions and take action to protect their cherished lakes and the Lake Lifestyle.
When you work with Clean-Flo International, you can expect:
- Regular updates on the progress of your lake’s remediation
- Clear explanations of the science behind our approach
- Accessible, easy-to-understand reports that you can share with your community
- A focus on the key parameters that directly impact lake health
- Transparency and open communication throughout the process
We know that restoring a lake to its former glory takes time and effort, but with our expertise and your commitment, we can work together to Save the Lake Lifestyle for generations to come.
Let us help you navigate the complex world of lake management and provide you with the tools and knowledge you need to make informed decisions for your community
Download the Lake Management ACTION Plan E-Book
Ready to explore how oxygenation can transform your lake? Download Clean-Flo’s Lake Management ACTION Plan E-Book to learn more about our innovative solutions, real-world results, and how we can help restore and protect your lake.

